Decoding the Crypto Market: Your Guide to Technical Indicators
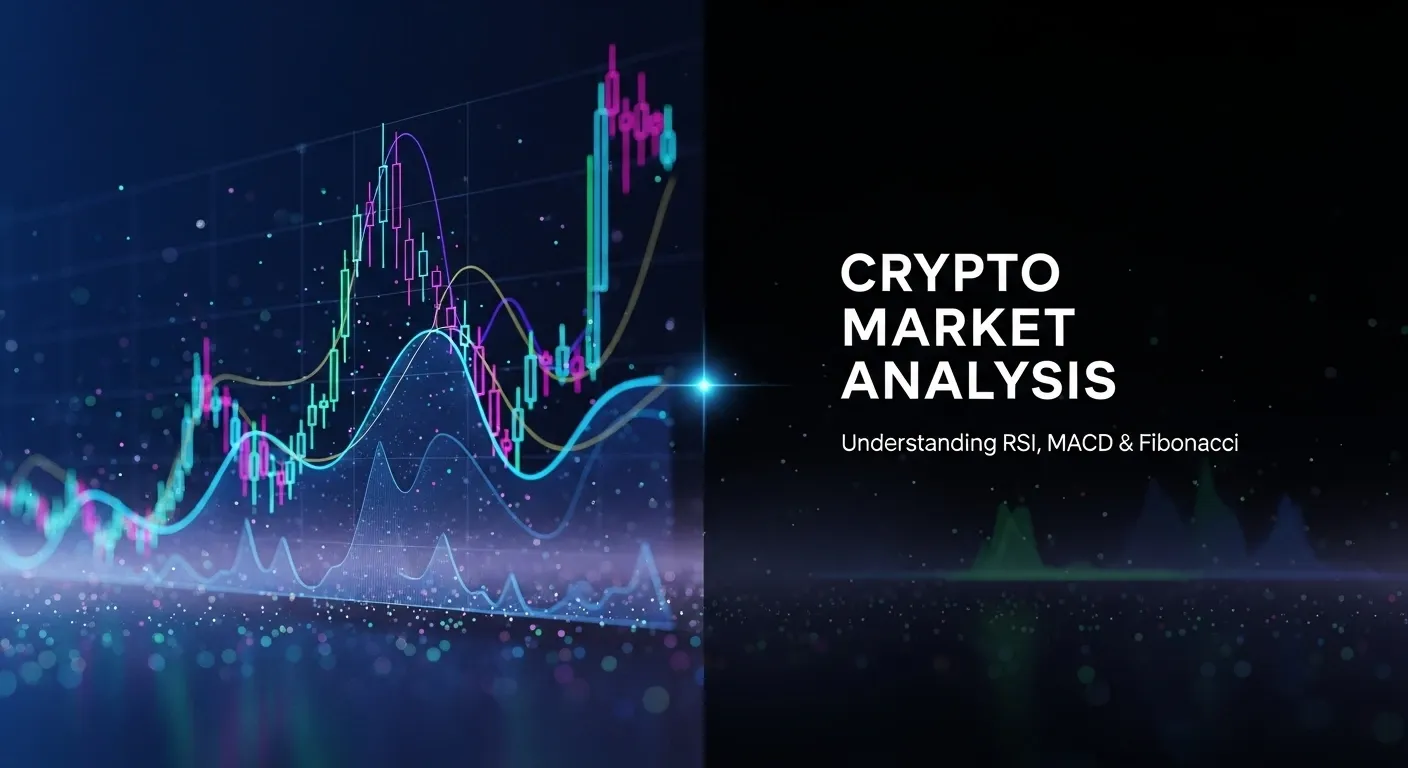
The cryptocurrency market is a rollercoaster of opportunity and risk, where prices can skyrocket or crash in hours. For newcomers and seasoned traders alike, making sense of this chaos is daunting. Enter technical indicators—powerful tools that transform raw price data into clear signals, helping you navigate the wild swings of Bitcoin, Ethereum, or DeFi tokens. These mathematical calculations, rooted in historical data, reveal trends, predict movements, and guide smarter trading decisions. This mobile-friendly guide dives deep into technical indicators, offering practical insights, real-world examples, and strategies to thrive in the crypto space, while balancing them with sentiment analysis and external factors for a holistic approach.
TL;DR
- What They Are: Technical indicators use price, volume, or open interest to forecast crypto market trends and guide trading decisions.
- Top Tools: Moving Averages, RSI, Bollinger Bands, MACD, and Fibonacci Retracement help spot trends, momentum, and volatility.
- Trend Spotting: These tools pinpoint entry and exit points, reducing risk in speculative markets like NFT gaming or mining tokens.
- Beyond Indicators: Combine with sentiment analysis and awareness of regulations, AI advancements, or scams for better accuracy.
- Stay Cautious: Indicators rely on past data and can’t predict sudden events, so balance them with fundamental analysis.
Why Technical Indicators Matter
Cryptocurrency markets are notoriously volatile, with Bitcoin swinging 20% in a single day or Solana surging on DeFi hype. Technical indicators act like a compass, cutting through the noise to reveal patterns. By analyzing price and volume data, they help traders identify whether a coin is trending up, down, or sideways, and whether it’s overbought or ready for a rebound. For example, during Ethereum’s 2024 rally, traders using indicators like RSI avoided buying at peak prices, saving them from losses when the market corrected. Whether you’re trading established coins or exploring emerging trends like ReFi (Regenerative Finance), these tools are your foundation for informed decisions.
Understanding Technical Indicators
Technical indicators are calculations based on a cryptocurrency’s price, trading volume, or open interest (the number of open contracts in futures markets). They distill complex market data into visual signals—lines, bands, or numbers—that highlight trends or momentum. Available on platforms like TradingView or Binance, these tools are accessible to beginners and pros alike. They’re especially critical in crypto, where 24/7 trading and global sentiment create rapid shifts. Indicators don’t predict the future with certainty, but they provide a data-driven edge, helping you time trades or avoid costly mistakes.
Real-World Impact
In 2024, Bitcoin’s price surged past $80,000 before plummeting 15% in a week. Traders using technical indicators like Moving Averages spotted the downtrend early, exiting positions before losses mounted. Similarly, in the DeFi space, indicators helped traders navigate Polygon’s volatility as it integrated with AI-driven protocols, showcasing their value across diverse crypto sectors.
The Best Technical Indicators for Crypto
Here’s a breakdown of the most effective indicators, optimized for crypto’s unique volatility:
1. Moving Averages (MA)
What It Does: Moving Averages smooth out price fluctuations, creating a single line that shows the trend’s direction over a set period (e.g., 50 or 200 days).
Types:
- Simple Moving Average (SMA): Averages prices equally, great for long-term trends.
- Exponential Moving Average (EMA): Weights recent prices more heavily, ideal for short-term swings.
Use Case: In Solana’s 2024 bull run, a 50-day EMA crossing above the 200-day EMA signaled a buy opportunity, helping traders ride a 30% surge.
Mobile Tip: On mobile apps like Binance, set alerts for EMA crossovers to catch trends on the go.
2. Relative Strength Index (RSI)
What It Does: RSI measures price momentum on a 0–100 scale, identifying overbought (above 70) or oversold (below 30) conditions.
Use Case: In AI-driven crypto tokens, RSI helps gauge sentiment shifts. For instance, when an AI token hit 75 on RSI in 2024, traders sold before a 10% dip, avoiding losses.
Mobile Tip: Use RSI on TradingView’s mobile app to quickly check if a coin is overbought during a Twitter-driven pump.
3. Bollinger Bands
What It Does: Bollinger Bands plot a Simple Moving Average with two bands (standard deviations) above and below it, reflecting volatility. Bands widen in volatile markets and narrow in calm ones.
Use Case: Bitcoin’s 2024 volatility made Bollinger Bands a go-to tool. When prices touched the upper band, traders anticipated pullbacks, timing exits perfectly.
Mobile Tip: On mobile, zoom into Bollinger Bands on a 1-hour chart to spot short-term breakout signals.
4. Moving Average Convergence Divergence (MACD)
What It Does: MACD tracks the difference between two EMAs (e.g., 12-day and 26-day) and a signal line. Crossovers indicate momentum shifts.
Use Case: In mining-centric tokens, a bullish MACD crossover in 2024 signaled a 25% rally, guiding traders to profitable entries.
Mobile Tip: Set MACD alerts on mobile platforms to catch crossovers without staring at charts.
5. Fibonacci Retracement
What It Does: Fibonacci levels (23.6%, 38.2%, 50%, 61.8%) identify potential support or resistance zones based on historical price swings.
Use Case: In NFT gaming tokens, Fibonacci levels helped traders buy at the 61.8% retracement during a 2024 dip, catching a 40% rebound.
Mobile Tip: Use mobile charting tools to draw Fibonacci levels during market dips for quick entry decisions.
Combining Indicators for Smarter Trades
Using a single indicator can lead to false signals, but combining them creates a robust strategy. For example:
- RSI + Bollinger Bands: If RSI shows an overbought coin and the price hits the upper Bollinger Band, it’s a strong sell signal. This worked for Polygon traders in 2024, avoiding a 15% crash.
- MACD + Moving Averages: A bullish MACD crossover paired with a 50-day EMA crossing above the 200-day EMA confirms a strong uptrend, ideal for long-term buys in Bitcoin.
- Fibonacci + RSI: Buying at a Fibonacci support level when RSI is oversold (below 30) can pinpoint low-risk entries, as seen in Ethereum’s 2024 recovery.
Mobile Strategy: On mobile apps, layer these indicators on a single chart (e.g., TradingView) and use pinch-to-zoom for clarity. Save custom templates to switch between setups quickly.
The Power of Sentiment Analysis
Technical indicators shine brightest when paired with sentiment analysis. Crypto markets are driven by human emotions—hype on X, fear from regulatory news, or excitement over blockchain adoption by Visa or Mastercard. Sentiment tools, like tracking Twitter mentions or Google Trends, reveal the market’s mood. For instance, in 2024, positive sentiment around ReFi projects amplified bullish MACD signals, leading to profitable trades. Conversely, negative sentiment from a high-profile crypto scam can override technical signals, so always cross-check.
Mobile Tip: Use mobile apps like CoinGecko to monitor sentiment via social media activity or news alerts, complementing your indicator analysis.
External Factors Shaping the Market
Crypto markets don’t exist in a vacuum. External forces like political decisions, technological advancements, and macroeconomic trends play a huge role:
- Regulations: The EU’s 2024 crypto regulations briefly tanked DeFi tokens, catching traders off guard who relied solely on indicators.
- AI Integration: AI-powered trading bots, using machine learning to refine indicator signals, are transforming markets, as seen in 2024’s AI token boom.
- Blockchain Adoption: Central banks exploring CBDCs and companies like Visa embracing crypto payments create bullish sentiment, impacting technical signals.
- Political Funding: Cryptocurrencies funding 2024 U.S. election campaigns introduced new volatility, requiring traders to stay informed.
Mobile Tip: Set news alerts on mobile apps like Blockworks or CoinDesk to stay updated on external events while monitoring indicators.
Risks of Over-Reliance on Indicators
Technical indicators are powerful but not foolproof. They rely on historical data, which can’t predict sudden disruptions like:
- Crypto Scams: A 2024 rug pull in a DeFi project tanked prices, ignoring bullish RSI signals.
- Regulatory Shocks: Unannounced bans or tax laws can flip trends overnight.
- Black Swan Events: Unexpected hacks or exchange failures can invalidate technical patterns.
To mitigate risks, combine indicators with fundamental analysis (e.g., evaluating a project’s tech or team) and sentiment tracking. For example, researching a DeFi project’s whitepaper alongside RSI can reveal if a low RSI is a buying opportunity or a sign of deeper issues.
Practical Tips for Mobile Traders
Trading crypto on mobile is convenient but requires optimization:
- Choose the Right Apps: Use TradingView, Binance, or Kraken for real-time charts and indicator overlays.
- Simplify Charts: Stick to 1–2 indicators (e.g., RSI and EMA) on smaller screens to avoid clutter.
- Set Alerts: Configure price or indicator alerts to stay updated without constant monitoring.
- Stay Informed: Follow X accounts or news apps for sentiment and regulatory updates.
- Practice First: Use demo accounts on mobile platforms to test indicator strategies risk-free.
Conclusion
Technical indicators are your toolkit for navigating the crypto market’s wild swings, from Bitcoin’s surges to NFT gaming volatility. Tools like Moving Averages, RSI, Bollinger Bands, MACD, and Fibonacci Retracement offer clarity, helping you time trades and reduce risks. Yet, they’re only part of the equation. By blending indicators with sentiment analysis and staying informed about external factors—like AI advancements, regulatory shifts, or blockchain adoption by institutions—you’ll build a well-rounded strategy. Whether you’re trading on a mobile app or a desktop, mastering these tools empowers you to thrive in the dynamic world of cryptocurrency.
FAQs
What are the best technical indicators for beginners?
Moving Averages and RSI are beginner-friendly, offering clear signals for trends and overbought/oversold conditions. Start with these on mobile apps like Binance.
How does technical analysis differ from fundamental analysis?
Technical analysis uses price and volume data for short-term predictions, while fundamental analysis evaluates a project’s tech, team, and long-term potential, like DeFi innovations.
Can AI improve crypto trading?
Yes, AI algorithms enhance indicator accuracy by analyzing vast datasets, as seen in 2024’s AI-driven crypto trading boom.
How volatile is the crypto market?
Extremely volatile—Bitcoin and altcoins like Solana can swing 10–20% daily, driven by speculation, news, or sentiment shifts.
What are the risks of relying only on technical indicators?
Indicators miss sudden events like scams, hacks, or regulations, so pair them with fundamental analysis and news tracking for better results.
How can I stay updated on crypto trends?
Follow X accounts, news apps like CoinDesk, and events like the WAGMI Crypto Conference to stay ahead of blockchain and market developments.


Discussion